
How much does work-from-home flexibility actually matter?
In Ennova’s Panel Survey 2025, employees with full or near-full WFH flexibility have an average Satisfaction & Motivation score of 74, compared with 64 among employees with no flexibility. They also report less sick leave: 47% report some sick leave during the past 12 months, compared with 69% among employees with no flexibility.
At first glance, those numbers look like a strong case for greater flexibility.
Look closer, and the story becomes more nuanced. For sick leave, the only statistically significant difference is between employees with full or near-full flexibility and those with none. For satisfaction and motivation, the differences are no longer statistically significant once additional workplace-experience drivers are included.
Two outcomes. Two different stories.
One important distinction: we are looking at employees’ flexibility to work from home, not how often they actually choose to do so.
For HR, the practical takeaway is simple: treat flexibility as a signal to investigate, not as a ready-made policy answer.
Jump to:
- More Than One in Two Employees Cannot Work From Home
- Satisfaction Rises With Flexibility, but Flexibility Doesn't Explain the Difference
- The Sick-Leave Result Tells a Different Story
- The Significant Difference Appears at Full or Near-Full Flexibility
- What the Two Findings Tell Us Together
- Stop Looking for One Perfect Number of Office Days
- How To Turn These Findings Into Action
More Than One in Two Employees Cannot Work From Home
First, one number matters: 53% of respondents have jobs that cannot be performed from home.
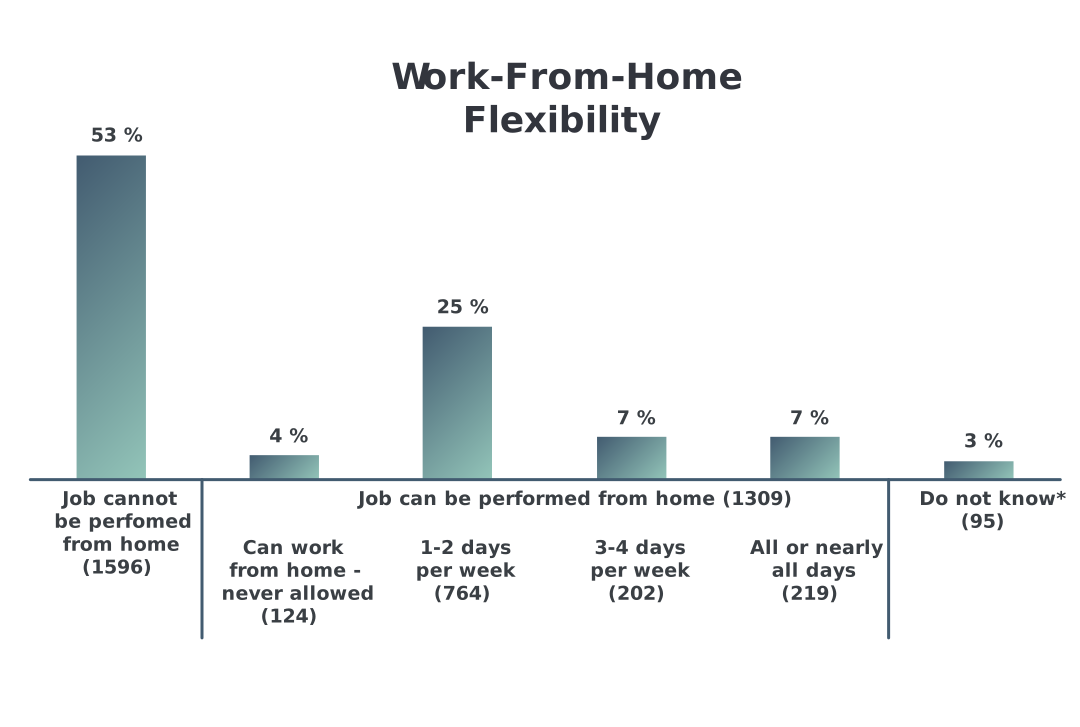
48 respondents answered "Do not know" to whether their job can be performed from home, and 47 answered "Do not know" to how often they are allowed to work from home.
More than one in two.
Hybrid-work debates can easily become office-worker debates. For many employees, the question is not whether to work from home two or three days a week. The job simply cannot be done from home.
This analysis focuses on employees whose jobs can be performed from home and asks what we see when the level of flexibility differs.
Satisfaction Rises With Flexibility, but Flexibility Doesn't Explain the Difference
The descriptive results form an almost perfect staircase.
Employees with no WFH flexibility have an average satisfaction and motivation score of 64. For employees allowed to work from home 1–2 days per week, it is 69. At 3–4 days, it reaches 71. Among employees allowed to work from home all or nearly all days, it reaches 74.
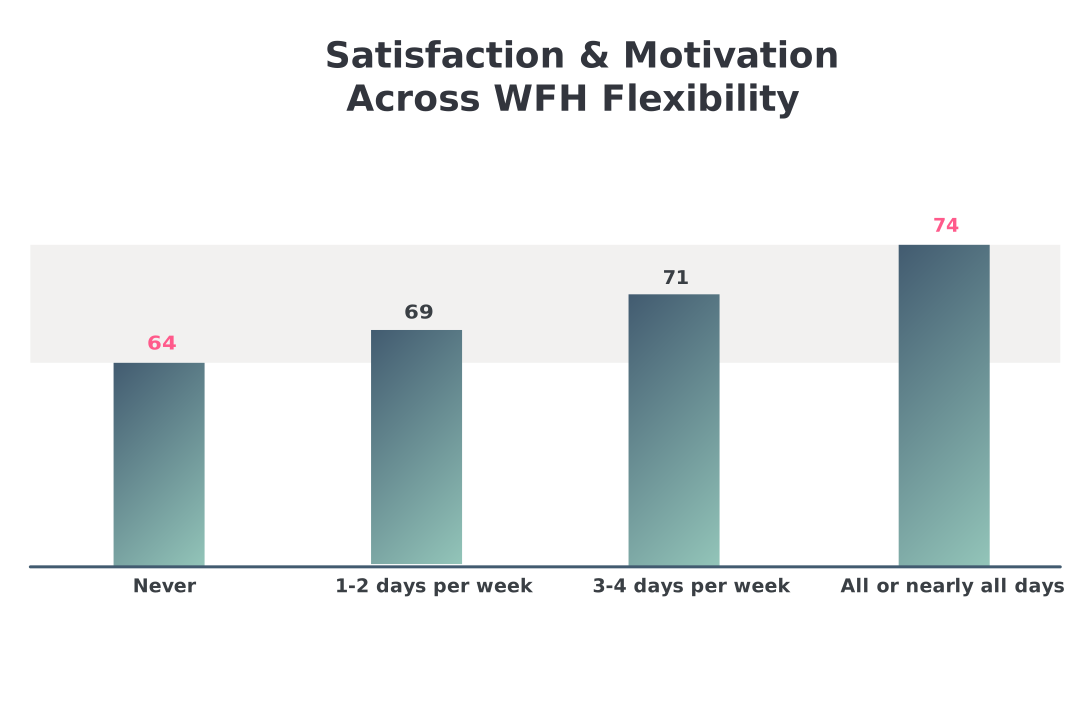
Satisfaction & Motivation Across WFH Flexibility. N = 1,304. Includes only respondents whose jobs can be performed from home, with a Satisfaction & Motivation score, and excludes respondents who answered “Do not know” to “How often are you allowed to work from home?”
64 → 69 → 71 → 74.
That is a 10-point difference between employees with no WFH flexibility and those with full or near-full flexibility.
At first glance, the conclusion seems obvious: more flexibility, higher satisfaction and motivation.
The statistical analysis adds an important layer. When we account for demographic and workplace characteristics, employees with WFH flexibility still report significantly higher satisfaction and motivation than employees with no flexibility. However, once additional workplace-experience drivers are included, those differences are no longer statistically significant.
That changes the interpretation.
The data does not support saying that WFH flexibility, by itself, increases satisfaction and motivation. Instead, WFH flexibility appears to be part of a broader employee-experience picture rather than a standalone explanation.
This finding fits with something we have seen elsewhere in our research. In an analysis of almost 43,000 employees, physical proximity itself did not systematically explain employee engagement. Employees sitting together were not automatically more engaged, and employees sitting close to their manager did not consistently score higher.
This finding points in the same direction: where people work is only one part of the employee experience, and it should not be treated as a standalone explanation for engagement.
The Sick Leave Result Tells a Different Story
The sick-leave numbers become easier to grasp if we translate them into people.
Imagine 100 employees whose jobs can be performed from home but who have no WFH flexibility. 69 out of those 100 report some sick leave during the past 12 months.
Now imagine 100 employees with full or near-full WFH flexibility. Here, 47 out of 100 report some sick leave during the same period. 69 versus 47.
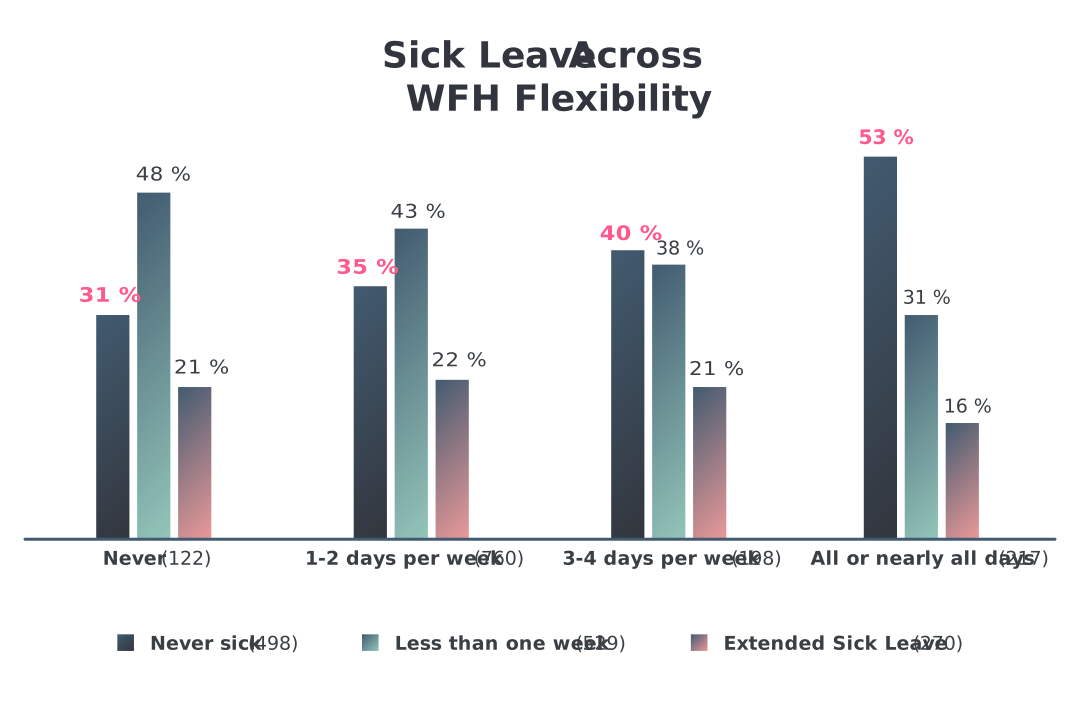
N = 1,297. Includes only respondents whose jobs can be performed from home and excludes those who answered “Do not know” to “How often are you allowed to work from home?” and those who answered “Prefer not to answer” to “Have you had any sickness absence within the past 12 months?”
That is a difference of 22 employees in every 100.
The Significant Difference Appears at Full or Near-Full Flexibility
After controlling for demographic and workplace characteristics, only employees with full or near-full WFH flexibility report significantly lower sick leave than employees with no WFH flexibility.
The intermediate groups show lower sick leave descriptively, but the analysis does not establish that they are statistically different from the no-flexibility group.
So the data does not support a simple rule that more flexibility means less sick leave.
There is another useful detail. The share reporting extended sick leave is relatively stable across the four groups: 21%, 22%, 21% and 16%. The larger movement appears in shorter absence: 48% of employees with no WFH flexibility report less than one week of sick leave, compared with 31% among employees with full or near-full flexibility.
This is why we should be careful with words such as “healthier.” We are measuring reported sick leave, not health itself.
A separate question shows another, smaller difference. Among respondents to the separate question about working while ill (N = 1,279), 64% of employees with full or near-full flexibility report having worked while ill, compared with 59% of employees with no flexibility. That may say more about how people manage short bouts of illness than about how healthy they actually are.
One possible explanation is that some employees use WFH flexibility on days when they might otherwise report sick leave. Further analysis would be needed to determine whether this is indeed the case.
What the Two Findings Tell Us Together
For satisfaction and motivation, the descriptive difference is substantial: 64 versus 74. Yet that relationship is no longer statistically significant once additional workplace-experience drivers are included.
For sick leave, employees with full or near-full WFH flexibility still report significantly lower sick leave than employees with no flexibility after controlling for demographic and workplace characteristics. The lower-flexibility groups do not show statistically significant differences from the no-flexibility group.
So different employee outcomes tell different stories. That should make us cautious about reducing hybrid work to a single question about the ideal number of office days.
Flexibility Isn't the Full Answer. What Is?
The data points to something bigger than a WFH policy. 8 Steps to Successful EX gives HR a practical roadmap for turning findings like this into action.
Stop Looking for One Perfect Number of Office Days
Hybrid-work discussions have a habit of gravitating towards a number. Two days. Three days. Four.
We have previously argued that one-size-fits-all return-to-office policies overlook very different hybrid realities. We have also found that physical proximity itself does not reliably explain engagement.
This analysis adds another piece: WFH flexibility is associated with meaningful differences in employee outcomes, but it does not operate independently of everything else employees experience at work.
So instead of starting with: “How many days should employees be in the office?”
Start with: “What actually happens to different groups of employees under different working conditions?”
How To Turn These Findings Into Action
Separate Different Working Realities
Employees who cannot work from home should not disappear inside the same hybrid-work discussion as employees who can. Even among WFH-capable employees, looking at different flexibility groups separately gives HR a more useful picture than one company-wide average.
Look Beyond Flexibility Itself
If satisfaction or motivation differs between groups, do not immediately assume the WFH policy explains it. Our results show why: the initial differences vanish once wider workplace-experience drivers are included.
Ask instead: What else differs between these employee groups?
Treat Sick Leave as a Signal to Investigate
If your own data shows a similar sick-leave pattern, explore it. Is the difference mainly in shorter absence? Does it vary by role, team or manager? Does the relationship remain once other differences between the groups are taken into account?
The finding gives you a reason to investigate.
WFH flexibility tells you what employees are allowed to do. It does not tell you how they actually work or what else shapes their experience.
That’s a pattern worth remembering: this data shows you the outcome, not the reason behind it. The sick-leave signal tells you where to look. Finding out why still takes closer investigation.
Engagement surveySee What Sits Behind the Difference
Flexibility alone doesn't explain the gap. A full Employee Engagement Survey helps identify the workplace factors most closely connected to satisfaction, motivation and engagement.
|